1Introduction
1.1Motivation
The characterisation of low viscosity polymeric fluids is essential to many industrial applications. In particular extensional deformations of a fluid are encountered in coatings, lubrication and atomisation. The use of polymer additives is known to influence the stability and dynamics of jet break up, where the inhibition of ‘satellite’ drops is desirable in inkjet printing for example.
The rheology of the fluid must therefore be ascertained in order to control such processes. These properties include the fluid relaxation time, the time taken for a fluid to return to its equilibrium state after a deformation, and the extensional viscosity. The transient uniaxial extensional viscosity is a function of the rate of stretching and is significantly different to the shear (dynamic) viscosity. For a Newtonian fluid Trouton (1906) showed that the extensional viscosity is three times greater than the shear viscosity. For polymeric solutions this ratio can be orders of magnitude greater due to the microstructural contributions to the viscosity, where a coil to stretch transition of the polymers resists capillary thinning under an extensional deformation. The timescale of this transition is called the extensional relaxation time.
Currently, little is known about the extensional viscosity of dilute polymer solutions in comparison to the shear viscosity. This property is difficult to test experimentally for dilute polymer solutions due to the limited number of configurations in which a pure uniform extensional flow can be imposed in the laboratory and the effects of a pre-shear history on the polymer are difficult to control Petrie, 2006.
To date filament stretching devices such as the Capillary Break up Extensional Rheometer (CaBER) have been shown to be able to probe relaxation in the range of 0.01 to 1 second Bazilevsky et al., 1990. This device consists of two moving endplates where a liquid bridge is formed between the upper and lower liquid cusps. The thinning filament radius at the midpoint and the tensile forces are then measured. Rodd et al. (2004) showed that the characteristic time and length scales of the setup form a constraint on the operability of CaBER. This occurs when the Ohnesorge and Deborah numbers are both less than one. The Ohnesorge number is a dimensionless number which relates the viscous forces to the inertial and surface tension forces. The Deborah number characterises the elasticity and viscosity of a material. Therefore the operation of CABER is limited for weakly viscoelastic liquids such as dilute polymer solutions. These limitations results in elastic end plate instabilities where decohesion of the liquid bridge from the end plate occurs, or the fluid filament thinning much too rapidly for observations to be meaningful.
Industrial applications require devices that can probe lower relaxation times that can be determined by CaBER. The Rayleigh Ohnesorge Jetting Extensional Rheometer (ROJER) employs an alternative approach to end plate stretching by following the dynamics of capillary driven jet break up, a new technique pioneered by Keshavarz et al. (2015). The significant advantage of this technique is the reduction in the characteristic length scale involved, from 6mm for the plate diameter in CaBER to an initial nozzle diameter equal to 200μm in ROJER. This allows ROJER to probe relaxation times down to the order of 60μs Keshavarz et al., 2015.
Utilising ROJER requires an understanding of the kinematics of the thinning jet filament. For a Newtonian fluid, this fundamentally consists of a force balance between the inertial, viscous and surface tension forces. For a polymeric fluid, additional elastic forces must be also considered. An overview of the theory underpinning capillary driven jet break up is given in the following section.
1.2History
Leonardo da Vinci was the first to study the behaviour of liquid jets in the sixteenth century. He correctly identified that drop detachment was a force balance between gravitational forces and the surface tension of the fluid Da Vinci, 1999. However Da Vinci mistakenly assumed that this mechanism was also responsible for the dynamics of jet break up.
Much later, in the early nineteenth century, Young (1805) highlighted the stabilising and destabilising influence of surface tension during jet breakup and Laplace (1805) formulated a mathematical description of the mean curvature in order to describe the Laplace pressure. Fundamentally the surface tension force balances against the gravitational force during drop formation, but once a cylindrical shape of the fluid filament is reached the mean curvature destabilises the surface and detaches the drop.
Savart (1833) significantly advanced experimental progress on the study of jet breakup shortly afterwards. He is credited with being the first to notice that the behaviour of jet break up is independent of the circumstances in which the jet is produced and developed a stroboscopic method where intermittent satellite drops were observed between two main drops.
Plateau (1873) observed experimentally that surface tension works to reduce the surface area of the jet and that perturbations were unstable if the wavelength was greater than a critical value. Strutt & Rayleigh (1878) subsequently introduced his method of linear stability analysis and discovered this critical wavelength is approximately nine times the initial jet radius, which is in good agreement with Savart’s experiments conducted some fifty years earlier.
Middleman (1965) published a dispersion relation for a linearly viscoelastic jet based on the Oldroyd fluid model for a polymeric fluid. It was found that although viscoelasticity promotes instability at first, the unravelling of polymer chains at a critical strain rate resists the capillary thinning of the jet and therefore enhances stability.
1.3Aims and Objectives
The aim of this report is to explore the capabilities of ROJER in characterising the intrinsic rheological properties of a fluid. This includes
understanding the dynamics of extensional rheology using ROJER, from onset of the initial instability to capillary driven jet break up
the formulation of a Newtonian and a non-Newtonian one dimensional numerical simulation as a means to probe different aspects of jet behaviour with different dimensionless parameters, without the computational cost of solving the full Navier Stokes equations
the determination of an operating range for ROJER by testing different fluid materials, nozzle designs and dimensionless parameter spaces
the measurement of the extensional properties of various test fluids using ROJER and validating the results against theoretical predictions, one dimensional numerical simulations and computational fluid dynamics.
2The Stability Theory of Liquid Jets
A mathematical description of jet instability is detailed in this section. Firstly a linear inviscid jet is considered, then a description involving viscosity and then viscoelasticity will follow.
The Navier Stokes equation for an incompressible, Newtonian jet of density ρ, pressure and dynamic viscosity μ is given by
where is the fluid velocity field and . The capillary pressure at the jet surface is given by the Young-Laplace equation
where and are the principle radii of curvature, γ is the surface tension and κ is the mean curvature. Assuming the jet is axisymmetric along the axis with a free surface denoted , then the mean curvature is
where the subscript denotes a spatial derivative. Equations 1 and 2 along with the incompressibility condition form the governing equations of the liquid jet.
To analyse the stability of a solution to these equations, a small perturbation is applied to an initial state. It is convenient to take the initial state to be , in other words along the reference frame moving at the jet velocity. The initial jet pressure is uniform and is equal to the Laplace pressure where is the initial jet radius.
2.1The Inviscid Jet
2.1.1Rayleigh’s Linear Stability Analysis
In the case of an inviscid jet the viscosity μ is equal to zero. Therefore by the conservation of momentum and incompressibility there exists a condition on the pressure in a linear approximation where quadratic terms are ignored
Axisymmetric perturbations are applied to the base state and pressure which are of the form
where denotes the radial direction and the axial direction. Note that Equation 4 is Laplace’s equation and is solved analytically using the method of separation of variables. The result is that perturbed pressure must be of the form
where the function satisfies the second order partial differential equation
The solution to Equation 7 is the modified Bessel function with amplitude and is bounded about .
Turning to the jet surface it is required that the Laplace pressure is satisfied. A perturbation of the jet radius is defined as
where is the initial radius of the jet. Substituting this into Equation 4, the pressure perturbation is given by
Equating this pressure perturbation to Equation 6 evaluated at relates amplitude to the interface displacement
Therefore the linearised expression for the pressure perturbation is given by
The linearised kinematic condition at the jet surface states that
and the linearised momentum equation states that
Combining Equations 12 and 13 yields a time evolution equation for the jet surface
Substituting the pressure perturbation from Equation 11 into the evolution equation yields the dispersion relation
since , another Bessel function. This result was first obtained by Strutt & Rayleigh (1878).
The dispersion relation described by Equation 15 demonstrates the dependency of the growth rate α on the ratio of the surface tension γ to the initial radius of the jet . For the growth rate to have real and positive roots, the margin of stability is found to be which implies that . In other words all modes where the wavelength is greater than the initial jet perimeter are potentially unstable, as concluded by Plateau (1873). By solving the dispersion relation 15 the maximum growth rate is given by
corresponding to the wavenumber
This is equivalent to a critical wavelength . The characteristic time scale for the instability is chosen to be a balance between inertia and surface tension
2.1.2The Long Wave Approximation
Given that the critical mode (also known as the Rayleigh mode) occurs when the wavelength is approximately nine times the initial jet radius, then it is appropriate to seek a longwave approximation to the dispersion relation.
By assuming the wavelength is large then the wavenumber is assumed to be much smaller than unity, therefore the modified Bessel functions which feature in Equation 15 reduce to their leading order terms, namely
Therefore the long wavelength approximation of Equation 15 is
This yields a non-dimensional maximum growth rate of
Figure 1 shows that there is a very good agreement between the long wavelength approximation (Equation 20) and the exact dispersion relation (Equation 15). The long wave approximation is less computationally expensive to solve than the full Navier Stokes equations and is found to be in excellent agreement according to Ambravaneswaran Ambravaneswaran et al. (2002).
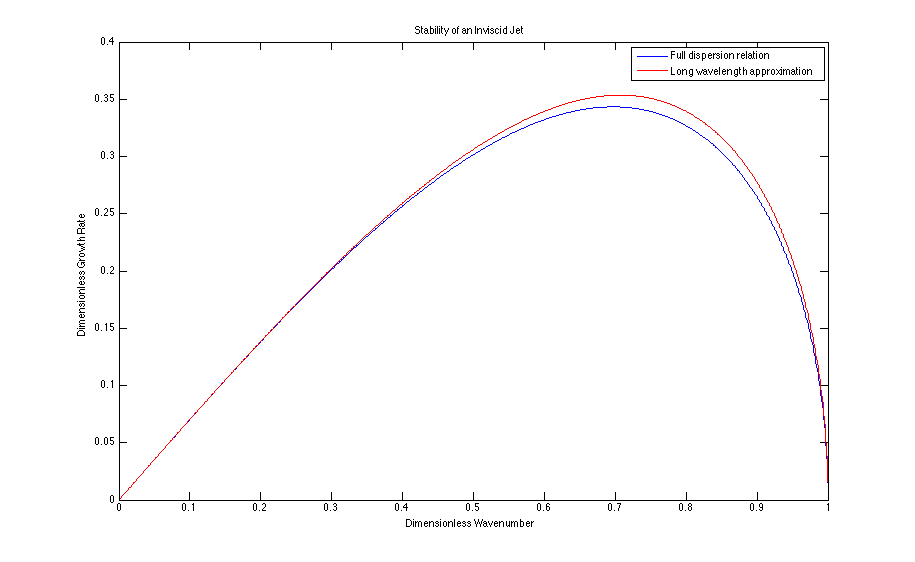
Figure 1:The dimensionless wavenumber against dimensionless growth rate for the exact dispersion relation 15 and the long wavelength approximation 20.
2.1.3The Critical Break Up Length of an Inviscid Jet
The critical break up length corresponds to the critical growth rate given by Equation 21. The radius of this disturbance is expected to grow according to the Equation
however the amplitude of this initial disturbance is unknown. The time taken for the perturbation to break up the jet can be found by assuming this corresponds to the time when . So the time taken for a perturbation at is
where the constant replaces the unknown ratio between the amplitude of the initial disturbance and the initial radius of the jet. If the break up length is defined as then
where the Weber number is defined as
and non-dimensionalised by the initial jet diameter . The Weber number is a useful dimensionless parameter in describing the ratio of fluid inertia to the surface tension.
2.2The Viscous Jet
2.2.1The Slender Jet Equations
The simplified analysis here involves the long wavelength description of the jet. Following Eggers & Villermaux (2008) the characteristic length scale and the time scale are chosen so that the balance of surface tension, inertia and viscous forces all enter the Navier Stokes equations at the leading order. That is,
This reduces the component of the full incompressible Navier Stokes equation to
In the case where the fluid is Newtonian the stress tensor is defined as
where is the velocity gradient tensor . The axial and radial stresses are therefore
so the Navier Stokes equation becomes
Additionally the kinematic equation reduces to a mass conservation law
The full curvature term κ in Equation 3 is retained in order to preserve the accuracy beyond the limit where .
The slender jet equations can therefore be easily expressed in flux conservative form
where
The slender jet equations form the basis for a one dimensional model of ROJER, which is verified in a team member report by Hall (2015).
2.2.2Linear Stability Analysis
Consider small perturbations to the slender jet equations about the initial state for the free surface height and velocity
where the perturbations are of the form
in which and denote the amplitude of the perturbation, denotes the wavenumber and α denotes the growth rate. Substituting this into the mass conservation equation (Equation 32) and linearising yields
Expanding this equation using the expressions in Equation 36 gives a relation for the amplitude of the free surface height perturbation and the velocity perturbation
Now substitute Equation 38 into the momentum equation 33 and linearise to get
Expanding this equation using the expressions in Equation 36 yields
Eliminating using the relation in Equation 38 gives the dispersion relation for viscous jets
As expected, the long wave description of the dispersion relation for an inviscid jet is (Equation 20) is recovered when . The dispersion relation also reveals that the maximum growth rate is
where the Ohnesorge number is defined as
The corresponding critical wavenumber is
Figure 2 shows the deformation of the dispersion curve with increasing Ohnesorge number. Viscous forces dampen the growth rate of the perturbation as expected and the value of most unstable wavelength increases for more viscous jets.
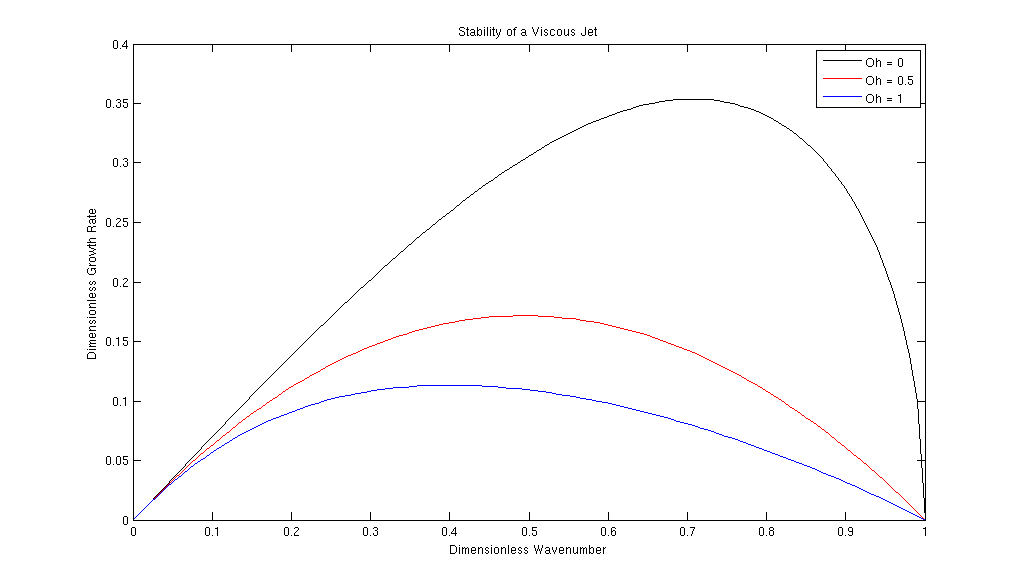
Figure 2:The dimensionless wavenumber against dimensionless growth rate for varying Ohnesorge numbers in the long wavelength approximation. Increasing fluid viscosity reduces the value of the growth rate and the critical wavelength for the most amplified mode increases.
2.2.3The Critical Break Up Length of Viscous Jets
Following a similar derivation outlined in Section 2.1.3, the critical break up length of a viscous jet is given by
where the Ohnesorge number is non-dimensionalised using also. From Equation 45 it can be seen the break up length of the jet increases with viscosity as the length of the most unstable wavelength increases, which is also reflected in Figure 2.
2.3The Viscoelastic Jet
This section incorporates the viscoelastic effects of the Oldroyd B model Oldroyd, 1950 into the slender jet equations derived in Section 2.2.1. This constitutive model is one of the simplest models for polymeric fluids in which polymers are described by Hookean bead spring dumbbells.
their relationship with the strain rate Goldin et al. (1969), most generally described by
experiment, usually a Couette device. A homogeneous shear is imposed on the flow of the form
The shear rate is
ds
s) ds ].
Therefore the expression for the stress becomes
the fluids ability to store elastic energy. The loss modulus is in phase with the shear rate and describes the dissipation of energy, in other words the viscosity. Therefore
+ .
A simple Oldroyd B approximation to the viscosity of a viscoelastic fluid is a summation of the solvent viscosity and the polymer contribution.
where is the elastic modulus and τ is the relaxation time. Therefore the slender jet approximation of the momentum equation becomes
Therefore the dispersion relation is
which is similar in form to the viscous Newtonian case (Equation 20). The maximum growth rate is
where
This model ensures that the viscosity is a monotonically decreasing function of the growth rate with the solvent viscosity being the lower limit.
2.4The Dynamics of Jet Break Up
In approach to the break up of the jet the radius approaches zero, which creates a singularity in the curvature term in the slender jet equations (see Equations 32 and 33). This means that break up behaviour is independent of the initial or boundary conditions since the scales involved are significantly different. It is therefore appropriate to look for a self similar solution by choosing a suitable scale transformation. The details of the asymptotic scaling laws are not within the scope of this report but are derived by Eggers (2005).
2.4.1The Universal Eggers Regime
A stable similarity solution predicts that a Newtonian jet will have a minimum radius of
where indicates the time to break up. Since this result is independent of the initial or boundary conditions, Equation 51 is universal. However there exists a critical Ohnesorge number which forms a boundary where the dynamics are initially governed by an inertial or viscous regime. Either regime will eventually transition to the universal Eggers regime in the last stages of pinching. The radius at which this final transition occurs is often beyond the scale of observation in experiment, but is verified numerically using the one dimensional slender jet equations Hall, 2015.
2.4.2The Inertial Regime
The similarity solution for an inertially dominated Newtonian jet was derived by Day et al. (1998) from the full inviscid Navier Stokes equations, as the profile of the jet overturns if the slender jet equations are evaluated. The solution for is found to be
and dimensional analysis shows that the natural length scale for the break up is
2.4.3The Viscous Regime
If the jet is initially dominated by viscous forces, then the minimum radius of the Newtonian jet follows
for . This was first derived by Papageorgiou (1995) by numerically solving Stokes flow using the slender jet equations, which yields the numerical pre-factor of 0.0709. This agrees well with the experimental evidence of McKinley & Tripathi (2000).
The critical Ohnesorge number distinguishing the boundary between the inertial and viscous regimes can be found by analysing the velocity of the thinning filament Campo-Deano & Clasen (2010). This yields a critical value of
2.4.4The Elastocapillary Regime
By choosing the Oldroyd B model as the constitutive equation for a polymeric fluid, Bazilevsky et al. (1990) showed that the the thinning diameter of the jet follows an exponential decay in the elastocapillary regime as follows
This behaviour corresponds to a local Weissenberg number greater than 0.5, where is the instantaneous strain rate. This indicates the beginning of the coil to stretch transition of the polymer, where viscoelastic effects contribute to the transient extensional viscosity . However the Oldroyd B model assumes that the polymers are Hookean bead spring dumbbells with an indefinite extensibility, therefore producing infinite forces which are not physically realistic. The alternative is to choose a constitutive equation such as the Finitely Extendible Non linear Elastic (FENE) model which imposes a finite extensibility on the polymer, however this introduces non linearity to the equations and does not allow closure to the problem Entov & Hinch (1997).
Both theoretical and experimental studies Entov & Hinch, 1997, McKinley, 2005 have shown that the local Weissenberg number remains constant at a value of 2/3 during the self similar elastocapillary thinning process. The polymer chains approach maximum extension and the instantaneous strain rate reaches a plateau. As the polymer contribution to the viscosity becomes saturated, the filament thins linearly and transitions to a viscocapillary regime.
3The Rayleigh Ohnesorge Jetting Extensional Rheometer
3.1Experimental Setup
The process begins with actuation in the nozzle, which is provided by a piezoelectric block. This perturbs the jet at an amplitude and frequency controlled by the wave generator. The jet is delivered via a high pressure syringe pump (PHD ULTRA-4400, Harvard Apparatus) at a selected flow rate . A Phantom high speed camera is used to capture images of jet break up at a typical frame rate of pictures per second with an exposure time of and a pixel resolution of . Due to the small exposure times involved, an LED light source is used in conjunction with a collimator to illuminate the picture in a uniform manner. Jet break up lengths are measured using a vernier caliper mounted beside the jet. For a schematic of the ROJER setup, please refer to Figure 3.
Figure 3:A schematic diagram of the ROJER setup. The liquid jet is perturbed by a piezoelectric actuator at the nozzle, with a driving frequency set by the signal generator. The motion of the jet is captured using a high speed camera. Graphic used with the permission of Greiciunas (2015)
3.1.1Nozzle Designs
There are two needle designs for the nozzle that will be tested in order to determine their effect on the operating range of ROJER. Nozzle 1 is based on an orifice design with a nozzle diameter of and is used to test Newtonian fluid materials only. This is due to concerns over potential flow blockages to the electron microscope aperture caused by testing viscoelastic fluids. This nozzle requires a stack of annular piezoelectric blocks (supplied by Thor Labs) surrounding the nozzle to drive the disturbance. The orifice design is assumed to exhibit a uniform jet exit velocity profile. Nozzle 1 is not cost effective and therefore the challenge is to test an alternative nozzle design.
The second nozzle is based on a disposable needle design. This is cheaper to manufacture in comparison to the first nozzle and relies upon two piezoelectric actuators clamped to the needle hub to provide the perturbation. The diameter of the hypodermic needle is and the length of the nozzle is . The length of this needle was selected using a laser microjet cutter and was chosen so that the pressure drop was small enough for the motor syringe pump to overcome. The advantage of this nozzle is that it is an ideal way of testing viscoelastic fluids owing to the disposable design. As a result of a CFD parameter study conducted by Greiciunas (2015) is is expected the needle design exhibits a fully developed parabolic exit velocity profile.
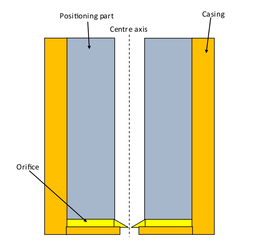
Needle 1 - the orifice design needle
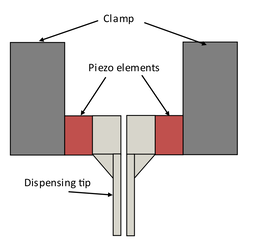
Needle 2 - the needle design needle
The schematics of the ROJER tested nozzle designs, images courtesy of Greiciunas (2015)
3.1.2Fluid Materials
For the fluid materials Newtonian and polymeric solutions are tested. Water and a water glycerol solution of a volume concentration will be used to benchmark the tests and provide a comparison of the performance of each nozzle design as their Newtonian properties are well characterised. A more viscous water glycerol solution of a concentration is tested in order to probe a higher Ohnesorge number parameter space. The extensional properties of ethyl hydroxy ethyl cellulose (EHEC) of molecular weight and poly ethylene oxide (PEO) of molecular weight are tested using the needle nozzle design and at different concentrations. This is typically be conducted at a flow infusion rate of which is not independent of nozzle exit effects - see Section 3.1.3 for further discussion. A table of physical properties for the fluids tested are given in Table 1. The surface tension γ was measured using the Wilhelmy plate method. For water this was found to be , for water glycerol and also for water glycerol . The surface tension for the polymer solutions were all measured to be which is the same as the solvent value. This is to be expected since surface tension is influenced only by the effects of intermolecular forces at the liquid-air interface, which is not altered by a colloidal suspension of the polymer. In general, increasing the amount of polymer added increases the zero shear viscosity of the solution and at higher shear rates the solution will approach the solvent viscosity, which is measured to be .
Table 1:Physical properties of all test solutions measured at . Note the percentage concentration is given by weight rather than volume. The dynamic (shear) viscosity μ was obtained using the cone and plate geometry in a torsional rheometer.
| Test Fluid | Water wt. % | Glycerol wt. % | Polymer wt. % | ||
| Water | - | - | - | 1.0 | 1,000 |
| Water-Glycerol 60-40% | 54.5 | 45.7 | - | 6.7 | 1,153 |
| Water-Glycerol 24-76% | 25.5 | 74.5 | - | 35.8 | 1,172 |
| EHEC 0.1% | 70.35 | 29.55 | 0.1 | 4.3 | 1,045 |
| EHEC 0.2% | 70.25 | 29.55 | 0.2 | 4.3 | 1,045 |
| EHEC 0.4% | 70.05 | 29.55 | 0.4 | 7.9 | 1,045 |
| EHEC 0.6% | 69.85 | 29.55 | 0.6 | 11.5 | 1,045 |
| PEO 0.1% | 70.35 | 29.55 | 0.1 | 3.6 | 1,045 |
The critical overlap concentration is a measure of “diluteness" of a polymer solution. A widely accepted definition proposed by Graessley (1980) is given by
where is the intrinsic viscosity. This is dependent on the polymer molecular weight through the Mark-Houwink expression
where the solvent quality parameter ν is 0.55 for EHEC and 0.56 for PEO Keshavarz et al., 2015, Sharma et al., 2015. The longest relaxation time of a dilute polymer solution can be described by the Rouse Zimm model
where is the solvent viscosity, is the ideal gas constant and is the temperature. It can be seen from this equation that the longest relaxation time is independent of the polymer concentration. For the test solutions EHEC 0.4, 0.6% and so these are therefore classed as semi dilute polymer solutions. Tirtaatmadja et al. (2006) show that the Rouse Zimm model is in good agreement with higher values of since the dependency on the molecular weight remains similar. Thus the longest relaxation time for EHEC dispersed in a water-glycerol solution is predicted to be and for PEO with the longest relaxation time is predicted to be . For a summary of the rheological properties of the polymeric solutions, please refer to Table 2.
Table 2:Rheological properties of the viscoelastic test fluids at . Four different concentrations of ethyl hydroxy ethyl cellulose (EHEC) and one concentration of poly ethylene oxide (PEO) were dispersed in a Newtonian solvent (water glycerol), which has a solvent viscosity of . The zero shear viscosity measurements were made using a torsional rheometer.
| Test Fluid | c % | ||||||
| EHEC 0.1% | 300 | 0.1 | 0.34 | 4.2 | 135 | 0.34 | 0.04 |
| EHEC 0.2% | 300 | 0.2 | 0.68 | 4.2 | 135 | 0.34 | 0.04 |
| EHEC 0.4% | 300 | 0.4 | 1.36 | 8.0 | 135 | 0.34 | 0.07 |
| EHEC 0.6% | 300 | 0.6 | 2.04 | 11.5 | 135 | 0.34 | 0.10 |
| PEO 0.1% | 250 | 0.1 | 0.44 | 6.9 | 145 | 0.37 | 0.03 |
3.1.3Exit Effects
Harmon (1955) showed using a simple momentum balance for a laminar flow that the diameter of a jet downstream of the nozzle exit is a factor of smaller than that of the nozzle diameter itself. This is because the shear stress exerted by the air on the free surface of the jet is negligible in comparison to the shear stresses experienced at the walls of the nozzle tube and so the fluid relaxes to a plug flow assuming there exists a fully developed a parabolic velocity profile at the exit.
However Harmon’s analysis fails to account for the effect of surface tension which is significant at smaller Reynolds number, or for the effect of viscosity in which some of the kinetic energy of the jet will dissipate into heat. An even greater possible source of error however is the assumption that the flow achieves a parabolic profile right at the nozzle exit. Changes to the velocity profile can occur before the nozzle exit since the effects of vorticity produced by Kelvin Helmholtz instability at the jet interface can diffuse upstream into the nozzle.
Goren & Wronski (1966) consider experimentally the expansion and contraction of a Newtonian jet downstream of the nozzle exit at different Reynolds numbers. Empirically they conclude that the critical Reynolds number to achieve a downstream diameter equal to the initial jet diameter is 14. Below this number the jet expands and above this number the jet contracts. For a flow infusion rate of the resulting Reynolds number of the flow is defined as
where is the initial jet velocity, is the initial jet diameter, ρ is the fluid density, μ is the dynamic viscosity and is the cross sectional area of the initial jet. A CFD parameter study exploring the effects of varying Reynolds number on jet contraction and expansion has been conducted by Greiciunas (2015) and Gorbatenko (2015).
In light of this study, it is concluded a Reynolds number flow of 14 must be enforced when operating ROJER with Nozzle 2 in order to avoid the effects of jet contraction or expansion. An alternative is to conduct a frequency sweep to determine an adjusted critical wavelength which corresponds to the shortest break up length. This adjusted critical wavelength takes into account the effect of jet expansion or contraction and comparison to Nozzle 1 can therefore be preserved.
3.1.4Image Analysis
A custom built program in MATLAB ® is used to post process the images captured by the high speed camera. The videos are stored in a lossless Tagged Image File Format (TIFF) in order to retain the maximum amount of image data from the camera. The program is also capable of post processing animations generated by CFD. These are stored in an MP4 video format at full high definition resolution.
A typical video captured consists of 16,000+ frames at a pixel resolution of captured with an exposure time of . For each frame the image processing program begins by converting the picture from a grayscale to an 8-bit format. The edges of the fluid filament become clearly identifiable and so the pixel widths of the filament along the axial direction can be calculated. A Lagrangian element is then chosen travelling at jet speed in which the midfilament diameter evolution can be recorded with time - see Figure 5. Once this Lagrangian element reaches the position of jet break up, the process restarts and another collection of thinning jet diameters is made. Over 500 collections of diameters are made in each video and so these are time averaged by placing the collections of diameters at a common break up time . The conversion from frames to time is computed using the camera speed and the conversion from pixels to metres is computed using the initial jet diameter . This process yields the overall evolution of the thinning midfilament diameter .
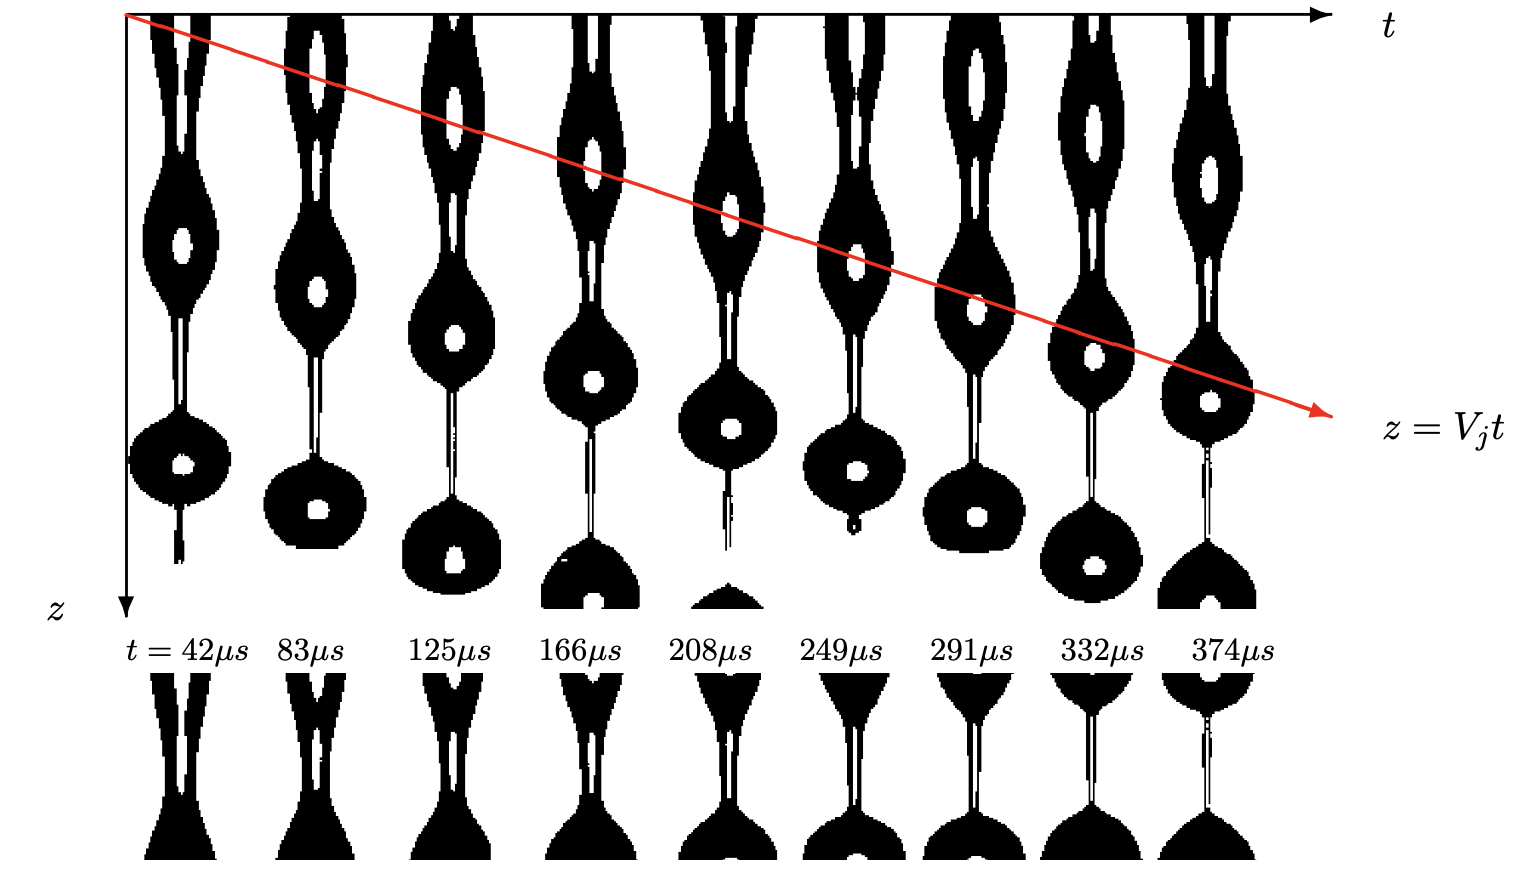
Figure 5:(Above) A montage of images of the a weakly viscoelastic jet captured using ROJER. (Below) The thinning midfilament diameter in a Lagrangian element of the jet moving at a jet speed of .
3.2Operation
By understanding the dynamics of capillary driven jet break up, ROJER can be used as an extensional rheometer in order to characterise the extensional properties of dilute polymer solutions.
As described in Section 2, it is expected that the initial Rayleigh-Plateau instability in the linear region of the jet will follow a midfilament diameter evolution of
where δ is the ratio of the initial perturbation amplitude to the initial jet diameter () and α is the growth rate according to the dispersion relation in Equation 41 for viscous jets and Equation 48 for viscoelastic jets.
As the instability grows, the strain rate increases and the decreasing midfilament diameter no longer adheres to Equation 61 due to significant resistance from viscoelastic stresses, resulting in a slower decay of . For Newtonian fluids, transition to the viscocapillary regime occurs when the viscous timescale divided by the inertial (Rayleigh) timescale becomes the order of unity Clasen et al., 2012
For polymeric fluids, transition to the elastocapillary regime occurs when the local Deborah number, which is the ratio of the polymer relaxation time to the inertia capillary timescale, is of order one
Here the thinning midfilament diameter of an Oldroyd B fluid follows Equation 56
and so by fitting this equation to the data in the elastocapillary thinning obtained by ROJER, it is possible to obtain the relaxation time of the fluid.
The evolution of the thinning midfilament diameter of a forced jet issued by ROJER is also the key factor to determining the transient extensional viscosity at an instantaneous strain rate . This is given by the expressions
as outlined by Anna & McKinley (2001).
3.3Reproducibility
The output can vary significantly depending on the wavenumber of the jet perturbation, especially given the unknown exit effects of Nozzle 2. It is therefore appropriate to validate the experimental results of ROJER with the expected growth rates outlined in Section 2.
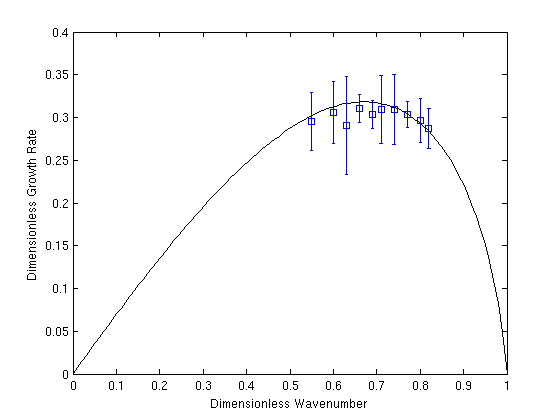
(a)The dimensionless wavenumber against the dimensionless growth rate for EHEC 0.4 wt.% using Nozzle 2 . The predicted growth rate derived from the linear theory is plotted as a solid black line and the observed growth rate is denoted by the blue squares.
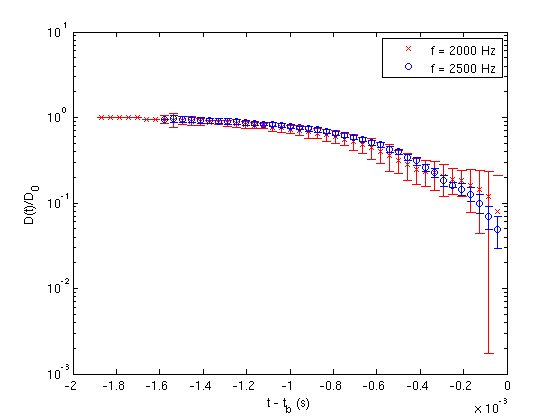
(b)The normalised jet midfilament diameter for EHEC wt.% . The jet is perturbed at apparent critical frequency corresponding to the most amplified growth rate, and a lower frequency corresponding to a wavenumber lower than the critical.
Figure 6:These graphs demonstrate a narrow band of wavenumbers between the most unstable one and the margin of stability is required to operate ROJER effectively. For Nozzle 2 these wavenumbers must be adjusted for empirically given jet contraction or expansion effects.
In Figure 6 (a), the growth rate α and the initial perturbation amplitude δ are determined by fitting a function of the form specified by Equation 61 to the linear region of the jet for each wavenumber tested. The theoretical growth rate is plotted also for comparison using the viscoelastic dispersion relation 48. This shows that the predicted values of the growth rate agree very well with the experimental values obtained using Nozzle 2, therefore ROJER is quite well described by the linear theory despite the nozzle exit effects. The theoretical critical wavenumber is calculated to be and it can be seen that the optimal operation of ROJER lies in the narrow band of wavenumbers between the most unstable one and the margin of stability, i.e. .
As mentioned in Section 3.1.4 over 500 collections of diameters are made in each video, in which is determined by placing all collections at a common zero and taking a time average. Another measure of the reproducibility of the results is to evaluate the standard error of the collections of diameters, for a 0.4 wt.% EHEC solution at varying frequencies using Nozzle 2. Figure 6 (b) shows the results of two such frequencies during a frequency sweep, in which the apparent critical frequency accounts for presumed jet contraction and corresponds to a lower wavenumber disturbance. The observations demonstrate that the optimal operating range for ROJER using Nozzle 2 improves if the perturbation wavenumber is closer to the apparent critical wavenumber corresponding to the most amplified growth rate. This is in agreement with the numerical results of Ardekani et al. (2010), where it was shown that the optimal range for extensional rheometry coincides with the absence of satellite drops. Preliminary experiments with ROJER have shown that weakly viscoelastic jets can generate satellite drops at low wavenumber perturbations, which diminish in size as the wavenumber approaches the apparent critical wavenumber. These satellite drops vanished at wavenumbers beyond this critical wavenumber but less than the margin of stability due to the enhanced stability provided by the polymers - see Figure 7.
In conclusion the effective operation of ROJER is achieved between the critical wavenumber and the margin of stability . It is required that this range must be adjusted for empirically when using Nozzle 2 due to nozzle exit effects.


Figure 7:(a) Wavenumbers below the most unstable wavenumber lead to the formation of satellite drops which merge with the leading drop. (b) Wavenumbers above the most unstable wavenumber suppresses the appearance of satellite drops and a stable beads on a string morphology is seen.
4Results and Discussion
An operating range with respect to varying Ohnesorge and Weber numbers is established. A comparison is then made between the two different nozzle designs using waterglycerol to benchmark the test. A small study evaluating measured jet break up lengths is used to estimate the amplitude of the initial jet perturbation. Finally the extensional properties of EHEC and PEO are extracted using ROJER.
4.1Operating Range
An operating range for ROJER is established by varying the Ohnesorge and Weber numbers of the jet. Recall
where μ is the dynamic viscosity of the fluid, ρ is the density, γ is the surface tension, is the initial jet diameter and is the velocity of the jet. Variation of these dimensionless parameters can be achieved through controlling the flow rate, fluid material and the implementation of the two different nozzle designs. The operating map for Newtonian fluids is presented in Figure 8.
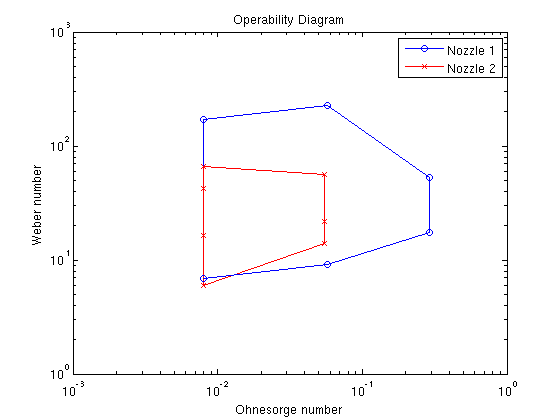
Figure 8:An operability diagram for ROJER showing the minimum and maximum Ohnesorge and Weber numbers required for the successful operation of the device.
The operating space for the needle design nozzle (Nozzle 2) is much more limited in scope than for the orifice design nozzle (Nozzle 1). A summary of minimum and maximum values of the dimensionless parameters for each nozzle are presented in Table 3.
Table 3:A table of values for the limits of the Ohnesorge and Weber for the two different nozzle designs.
| Nozzle 1 | 0.008 | 0.293 | 6.90 | 228.70 |
| Nozzle 2 | 0.008 | 0.055 | 5.95 | 66.2 |
4.2Nozzle Comparison
To compare the performance of the two nozzle designs, see Section 3.1.1, they will be used to characterise the properties of Newtonian fluids using ROJER. Their expected behaviour is validated using a one dimensional model by Hall (2015) and the Volume of Fluid (VOF) method in ANSYS Fluent by Greiciunas (2015) and in STAR-CCM+ Gorbatenko, 2015.
Water and a water-glycerol solution is tested. The frequency is controlled so that the most amplified growth rate is selected - see Section 3.3. The Ohnesorge numbers for water and water-glycerol are 0.008 and 0.056 respectively and can therefore be approximated as inviscid fluids. Using the longwave approximation to the dispersion relation (Equation 20) the critical wavenumber, wavelength and frequency resulting in the most amplified growth rate can therefore be calculated. A table summarising these experimental parameters plus dimensionless numbers are presented in Table 4.
Table 4:The critical experimental parameters and dimensionless numbers imposed on the Newtonian test fluids to compare the nozzle designs. Note that the dimensionless numbers are computed using the initial jet diameter . These parameters correspond to the most amplified growth rate.
| Wavenumber | Wavelength (mm) | Frequency (Hz) | Ohnesorge number | Reynolds number | Weber number | |
| Water | 0.70 | 0.90 | 2,949 | 0.008 | 531 | 19 |
| Water-Glycerol | 0.65 | 0.96 | 2,762 | 0.056 | 91 | 26 |
As outlined by the linear stability theory, it is expected that increasing viscosity increases the length of the most unstable wavelength. A flow rate of results in a very high Reynolds number flow for water in comparison to water-glycerol therefore nozzle exit effects in Nozzle 2 may be more pronounced in the case for water - see Section 3.1.3. Graphs of the evolution of the thinning diameters for water and water-glycerol are presented in Figure 9.
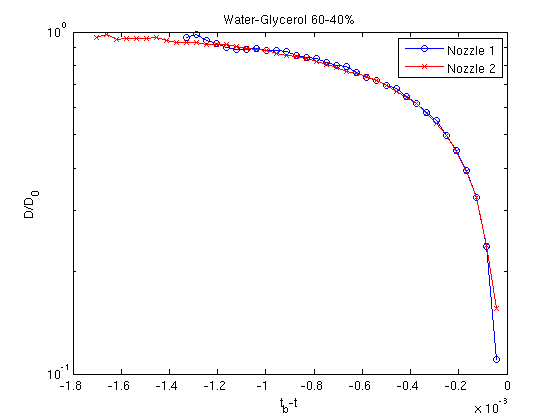
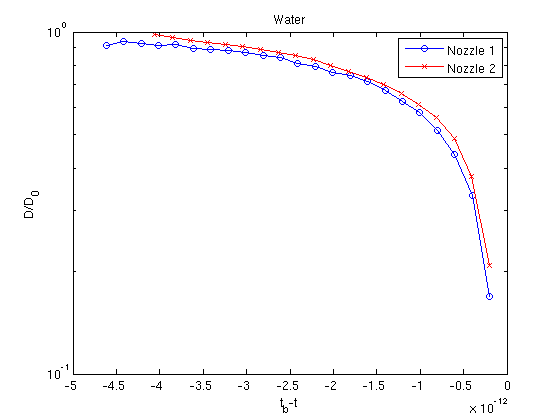
Figure 9:(a) The thinning midfilament diameter of a water and (b) water-glycerol jet over time.
A paired difference t-test is used to determine whether the impact of changing from Nozzle 1 to Nozzle 2 is significant in the case for water and for water-glycerol . A significance level of is selected. The mean difference is calculated
where is the number of paired samples, and and are the collections of diameters for Nozzle 1 and Nozzle 2 respectively. The standard deviation of the differences are then computed. The t-statistic is given by . Under the null hypothesis this follows a two tailed t-distribution with degrees of freedom. For water-glycerol which is less than the p-value of 2.037, therefore the null hypothesis is accepted and so the use of Nozzle 2 has no significant difference to the use of Nozzle 1 for a significance level to . For water and is greater than the p-value of 2.086, therefore the null hypothesis is rejected and so the use of Nozzle 2 does have a significant impact on the results. It can be speculated this could possibly be due to increased nozzle exit effects experienced at the higher Reynolds number flow for water.
Greiciunas (2015) was able to determine the rate of contraction/expansion in nozzle 2 by comparing the observed wavelength of the jet to the expected wavelength based upon the driving frequency. The apparent velocity and therefore in turn the Reynolds number of the flow can be inferred, whilst the downstream jet diameter is calculated through mass conservation. Experimental results of the Newtonian fluids are within acceptable limits of the data obtained by Middleman & Gavis (1961) however viscoelastic experiments do not compare well. This study may be limited by the pixel resolution of the images obtained from ROJER - see Section 4.5.
4.3Jet Break Up Lengths
Recall in Section 2.2.3 an expression was derived to predict the critical break up length of a linear inviscid jet
where denotes the unknown ratio between the initial diameter of the jet and the amplitude δ of the initial perturbation . It should be noted the Weber number is based on the initial jet diameter .
By measuring the critical break up lengths of the Newtonian test fluids using Nozzle 1, it is possible to experimentally determine the unknown parameter δ. The Ohnesorge number of these flows are much less than one, therefore an inviscid approximation is implemented. The break up lengths are measured using a vernier caliper mounted beside the jet. The results are presented in Figure 10.
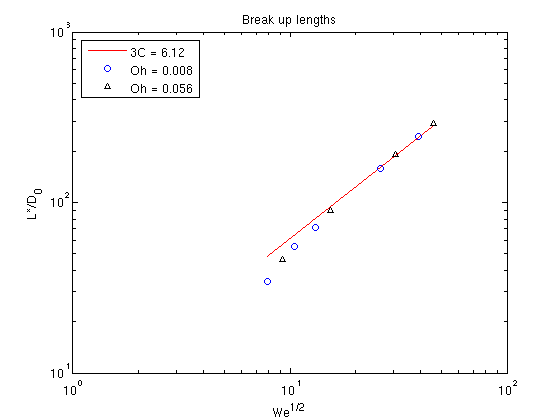
Figure 10:The experimental dimensionless critical break up lengths fitted with Equation 68. This gives an approximate jet perturbation amplitude of .
The Weber number was varied by adjusting the flow rate , and two Ohnesorge numbers were evaluated using water and water-glycerol as test solutions. It can be seen by fitting Equation 68 to the data that the experiments yield a value of . The initial perturbation amplitude is therefore computed to be which is of the initial jet diameter . This observation is much greater than the specified perturbation amplitudes used in the one dimensional and CFD simulations. Potential limitations of this experiment are discussed in Section 4.5.
4.4Viscoelastic Fluids
4.4.1EHEC Concentrations 0.1, 0.2, 0.4 and 0.6 wt.%
EHEC solutions with weight concentrations , 0.2, 0.4 and 0.6 wt.% were tested using Nozzle 2 (needle design). A voltage of and a constant flow rate of was applied. The jet is perturbed at a driving frequency corresponding to the most amplified growth rate , which is determined empirically through conducting a frequency sweep to identify the critical (shortest) break up length.
As discussed in Section 3.1.2, the predicted Zimm relaxation time was found to be , which is independent of the polymer concentration. Plots of for concentrations 0.1 and 0.2 % are presented in Figure 11, where the time axis is translated by the break up time .

Figure 11:The normalised thinning midfilament diameters of EHEC 0.1 and 0.2 wt.% . The expected exponential elastocapillary thinning regime cannot be observed, which could be due to insufficient camera speed.
It can be concluded that ROJER was not capable of capturing the elastocapillary region using the current setup for these polymer concentrations. The limit of the camera speed was frames per second, which is insufficient to provide the time resolution to observe the effect of the polymers uncoiling in the elastocapillary region. It is possible that the Ohnesorge number of is so low that the viscous forces could not overcome the fluid inertia for the viscoelastic stresses to prevail over the capillary forces. However the Ohnesorge number does not provide a full picture of the dynamics as it accounts for inertia, viscosity and surface tension only. It is therefore appropriate to evaluate the instantaneous strain rate using Equation 65 to determine whether the flow evolves into a uniaxial extension of sufficient magnitude, which is presented in Figure 12.

Figure 12:The strain rate over time for EHEC 0.1 and 0.2 wt.%
As detailed in Section 2.4.4 it is expected the instantaneous strain rate should plateau at a value approaching during elastocapillary thinning, which is indicated by the solid line in Figure 12. It can be clearly confirmed that this has not been achieved in the cases for 0.1 and 0.2 wt.% EHEC as there is no evidence of such a plateau, and so the polymer coil to stretch transition has not been observed.
The plot of for concentrations 0.4 and 0.6 wt.% are presented in Figure 13. Regression of Equation 64 to the data in the elastocapillary region is also plotted as a solid red line.

Figure 13:The normalised thinning midfilament diameters of EHEC 0.4 and 0.6 wt.% . Regression of the data in the elastocapillary region is plotted as a solid red line.
It is evident that ROJER has indeed captured the elastocapillary regime for these solutions given the exponential thinning observed. In addition it is possible to observe the transition from the elastocapillary regime to the viscocapillary regime for EHEC 0.4 wt.%, which is evidenced by the linear decay observed in the final approach to break up as the polymers achieve maximum elongation. For 0.4 wt.% EHEC the relaxation time was found to be and for 0.6 wt.% EHEC . These values are in good agreement with the predicted Zimm relaxation time of , especially given the validity of the Rouse Zimm model for semi-dilute polymer solutions discussed in Section 3.1.2. The relaxation times observed here by ROJER also show that they are independent of the polymer concentration where the molecular weight and solvent viscosity is controlled. The strain rate of the flow was also evaluated and the results are presented in Figure 14.

Figure 14:The instantaneous strain rate over time for EHEC 0.4 and 0.6 wt.%
In contrast to the instantaneous strain rates computed for 0.1 and 0.2 wt.%, the data here shows a plateau at a critical strain rate equivalent to . This confirms that elastocapillary thinning was indeed achieved by ROJER and the regression of Equation 64 is valid.
Graphs of the transient extensional viscosity extracted from the jet thinning dynamics via Equation 56 are presented in Figure 15. It is difficult to measure a well defined extensional viscosity here since the data from ROJER has been restricted to the last stages of thinning.
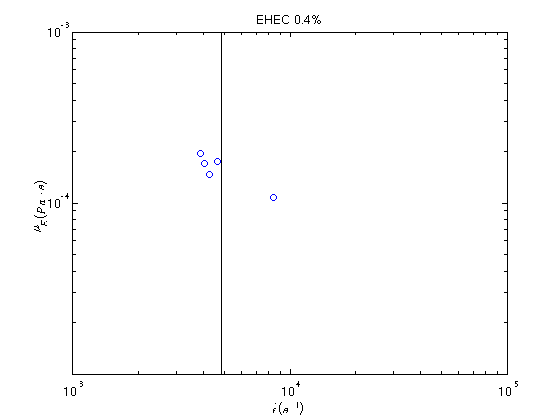
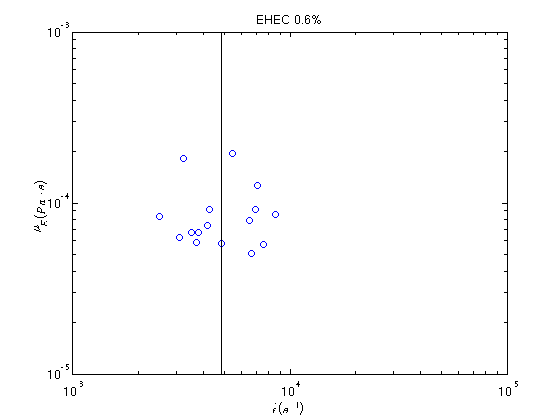
Figure 15:The transient extensional viscosity data of EHEC 0.4 and 0.6 wt.%. It is difficult to extract a well defined extensionanal viscosity here due to the limited dataset.
4.4.2PEO Concentration 0.1 wt.%
A PEO solution with a weight concentration of 0.1 wt.% was also tested using Nozzle 2 (needle design). In similar conditions to EHEC, a voltage of and a constant flow rate of was implemented at a driving frequency set to promote the most unstable wave mode.
In Section 3.1.2 it was predicted the Zimm relaxation time was for PEO. The evolution of the thinning midfilament diameter obtained by ROJER is presented in Figure 16.

Figure 16:(a) The normalised thinning midfilament diameter of PEO 0.1 wt.%. Only elastocapillary thinning has been captured. (b) The instantaneous strain rate over time for PEO 0.1 wt.%. All values deviate about the critical strain rate.
Figure 16 (a) shows that given the pixel resolution of the image, the linear region of the jet was unobservable and ROJER was able to capture the elastocapillary region only. By regression of the data to Equation 64 the relaxation time was determined to be . This is significantly different from the predicted Zimm relaxation time, which could suggest the window of data captured was not representative of the elastocapillary thinning process due to the limited camera resolution, or that the Rouse Zimm model is not valid in this case. Figure 16 (b) shows the evolution of the instantaneous strain rate , in which most of the data points deviate about the critical strain rate.
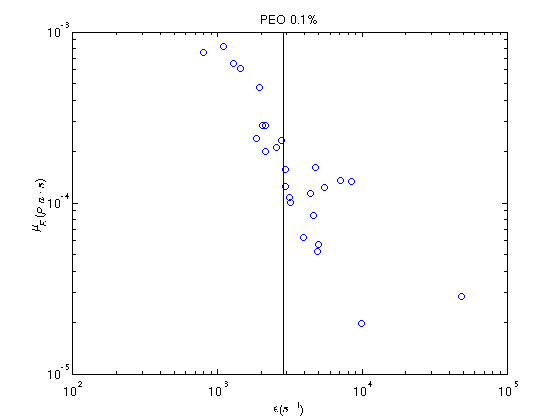
Figure 17:The transient extensional viscosity of 0.1 wt.% PEO. Here there is evidence of strain hardening characteristics.
The transient extensional viscosity presented in Figure 17 shows that PEO exhibits some appreciable strain hardening characteristics. Analysis of the instantaneous strain rate shows that a consistent plateau was not attained and a steady flow was not achieved, which may have significantly affected the fluid response to the flow. It is also worth noting that in theory the polymer is assumed to be monodispersed throughout the solution with a constant molecular weight, when in reality this not necessarily true despite careful preparation of the solutions. The molecular weight is in fact a distribution and the average is given by the supplier.
4.5Error Analysis
Following the results and discussion, it can be concluded that using ROJER as an extensional rheometer has its limitations as with any other measuring device. Given the ROJER setup is a new technique, it is important to address these limitations in order to aid further development of this design. A survey of the accuracy and precision of the system is therefore conducted in this section.
It has been clearly identified in Section 4.4.1 that image quality issues have a significant impact on the operation of ROJER. This in particular was highlighted in the tests for the 0.1 and 0.2 wt.% EHEC solutions in which the elastocapillary thinning regime was not possible to image. The Phantom camera was required to capture images at a high frame rate at a high magnification with a very short exposure time, which led to low resolution images and poor illumination. A possible solution to this problem is to image the jet stroboscopically, as employed by Keshavarz et al. (2015), where the light source is strobed at very short and bright light pulses. This can be synchronised close to the driving frequency of the jet perturbations which results in an apparent slow motion effect up to a factor of slower. A high resolution digital camera can then instead be used to capture sharper images, providing access to the visualisation of the break up process. This would also aid in the evaluation of the transient extensional viscosity by increasing the number of samples in the elastocapillary region.
Section 4.3 consists of a short break up length study in an effort to experimentally determine the magnitude of the perturbation amplitude δ. The value of δ obtained in this small study is likely to be influenced by mechanical error (using the vernier caliper) and nozzle exit effects which were detailed in Section 3.1.3 . The value of the perturbation amplitude δ is difficult to extract in general since the dynamics of the jet inside the nozzle is beyond the scope of this project. This presented a great challenge with regard to the simulation of the jet since the perturbation amplitude is a critical parameter in the specification of initial boundary conditions. Sensitivity studies were therefore conducted as a result (see Gorbatenko (2015), Greiciunas (2015) and Hall (2015)).
Unknown nozzle exit effects detailed in Section 3.1.3 can be manifested by the needle nozzle design in ROJER. Again this is difficult to quantify since the dynamics of the jet inside the nozzle are beyond the scope of this project. A study into the effects of jet contraction and expansion conducted by Greiciunas (2015) concluded that the jet contraction/expansion data obtained from ROJER for Newtonian fluids were within the limits of the data obtained by Middleman & Gavis (1961), however the experimental results for viscoelastic fluids did not agree. The effect of pre-stretch on polymers in the nozzle is therefore an avenue for further research.
5Conclusion
It has been shown the ROJER setup can form the basis of an extensional rheometer capable of characterising dilute polymer solutions at relaxation times far lower than what can be determined by alternatives such as CABER. In order to operate ROJER efficiently, this report has highlighted that the balance between the inertial, viscous and viscoelastic forces in capillary driven jet break up must be fully understood.
The optimal operating range for extensional rheometry was found to lie in the narrow band of wavenumbers corresponding to perturbations with the most amplified growth rate. If a needle design nozzle is to be used in ROJER, then these wavenumbers must be empirically adjusted for to account for nozzle exit effects, by conducting a frequency sweep to obtain the critical wavenumber which corresponds to the shortest jet break up length.
An operational map detailing the limits of ROJER in terms of the Ohnesorge and Weber numbers was also established. It was found the needle nozzle design occupied a much smaller operating space than the orifice design.
Measurements of the non linear elastocapillary thinning of the jet using ROJER were successfully verified using known theoretical predictions, numerical one dimensional simulations Hall, 2015 and computational fluid dynamics Gorbatenko, 2015, Greiciunas, 2015. In this report, encouraging results for the needle nozzle design showed that there was a good agreement between measured and theoretical Zimm relaxation times for EHEC solutions. However mechanical constraints, namely illumination and pixel resolution of the imaged jet, yield a limited dataset in which the extensional viscosity could not be sufficiently evaluated.
The outcomes of the work in this project could further be extended in the following ways
The outer boundaries in the operating map presented in Section 4.1 could be further expanded by testing a wider selection of water glycerol solutions of different concentrations, increasing the range of Ohnesorge numbers used. Use of an alternative precision syringe pump is potential solution to overcoming the stalling motor problem.
The validation of ROJER in the characterisation of polymeric solutions could have been expanded to polymers of different molecular weights with a wider spectrum of polymer concentrations. This would have aided in the validation or rejection of the Rouse Zimm model. Work by Clasen et al. (2006) seems to suggest that relaxation times are dependent on the polymer concentration.
Mechanical limitations in the illumination of the jet and the image pixel resolution was a clear hindrance to the project. Improvements to the mechanical design, such as the implementation of stroboscopic imaging, could greater extend the operability of ROJER as an extensional rheometer.
The image analysis program can be further improved by tracking not one, but multiple Lagrangian elements of the jet. This can increase the reliability of the computed thinning midfilament diameter, which would be most useful for post-processing CFD animations where the number of frames was more limited. Adding the capability to stitch together videos of different sections of the jet would also have been a useful function to overcome the limited pixel resolution.
The exit effects influenced by the nozzle geometry requires further study. Although initial investigations were conducted using CFD, the effect of pre-stretching of polymers in the nozzle is not understood and their effects should be quantified with respect to ROJER. Nevertheless the needle design does show promise as an alternative to the orifice design.
Acknowledgments
The author would like to thank the lead supervisor Dr Oliver Harlen for providing indispensable guidance throughout the project. The author would also like to thank Professor Nik Kapur for helping to develop the mechanical design of ROJER in his laboratory at the School of Mechanical Engineering, University of Leeds. It is acknowledged helpful discussion was provided by Dr Mark Wilson. The author would like to extend thanks to Dr Phil Threlfall-Holmes for introducing ROJER to the University of Leeds and to Dr Damien Vadillo for his industrial expertise on extensional rheology. This project was supported by the EPSRC Centre for Doctoral Training in Fluid Dynamics, University of Leeds.
- Trouton, F. T. (1906). On the coefficient of viscous traction and its relation to that of viscosity. Proceedings of the Royal Society of London. Series A, Containing Papers of a Mathematical and Physical Character.
- Petrie, C. J. S. (2006). Extensional viscosity: A critical discussion. Journal of Non-Newtonian Fluid Mechanics.
- Bazilevsky, A. V., Entov, V. M., & Rozhkov, A. N. (1990). Liquid filament microrheometer and some of its applications. Third European Rheology Conference and Golden Jubilee Meeting of the British Society of Rheology.
- Rodd, L. E., Scott, T. P., Cooper-White, J. J., & McKinley, G. H. (2004). Capillary break-up rheometry of low-viscosity elastic fluids.
- Keshavarz, B., Sharma, V., Houze, E. C., Koerner, M. R., Moore, J. R., Cotts, P. M., Threlfall-Holmes, P., & McKinley, G. H. (2015). Studying the effects of elongational properties on atomization of weakly viscoelastic solutions using Rayleigh Ohnesorge Jetting Extensional Rheometry (ROJER). Journal of Non-Newtonian Fluid Mechanics.